As defined by Investopedia, liquidity “describes the degree to which an asset or security can be quickly bought or sold in the market without affecting the asset’s price.” Hence, liquidity is one of the most essential qualities that traders and investors usually look for in modern crypto exchanges.
The liquidity of a given currency on an exchange can be characterized by various metrics including the bid-ask spread, order book depth, and trade volume. Although all these parameters should be valued together, in practice most users misjudge liquidity by only considering trade volume. This is the case because the trade volume is easy to understand and it has become the most common measure used to rank crypto exchanges. But it is also the easiest parameter to be manipulated.
Trading inside the spread is a method that is characterized by trades executed at a price that doesn’t match the best bid or the best ask, and appear somewhere in between, or simply within the spread. That means there is nobody willing to buy or sell at that particular price, so the trades look like they emerge from thin air.
However, such transactions can legitimately exist under certain circumstances. For instance, during periods of intense trading activity accompanied by a high price and spread volatility, some of the trades can be a result of two opposite market orders submitted at the very same time and matched by the trading engine at an algorithmically determined price within the spread.
There are some other more complex cases, but most of them have the same prerequisite of intense trading activity characterized by high volatility. Thus, some portion of trades can realistically occur inside the spread, but their rate should not exceed 20% of the total number of trades during periods of average volatility. Nevertheless, in most cases where trading inside the spread is detected, the vast majority of transactions (and sometimes even all of them) are usually executed somewhere between the best bid and ask even during relatively calm periods. And such blatant volume manipulation can be done only by exchanges themselves or by other entities on their behalf and with their consent.
While most exchanges add some complexity to their volume inflating algorithms, some of them don’t even bother to make trades look more realistic and stuff them just in the midpoint of the spread. For convenient visualization of the issue, we retrieved trades and best bid/ask data for a period of 3 minutes and plotted them all together for each example. The data in the samples we retrieved may not be representative due to its small size, but all the same, it serves to show some examples of misleading trading activity.
Later, we will show some illustrations of trading inside the spread, but at first here’s how normal trading looks like (see Graph 1).
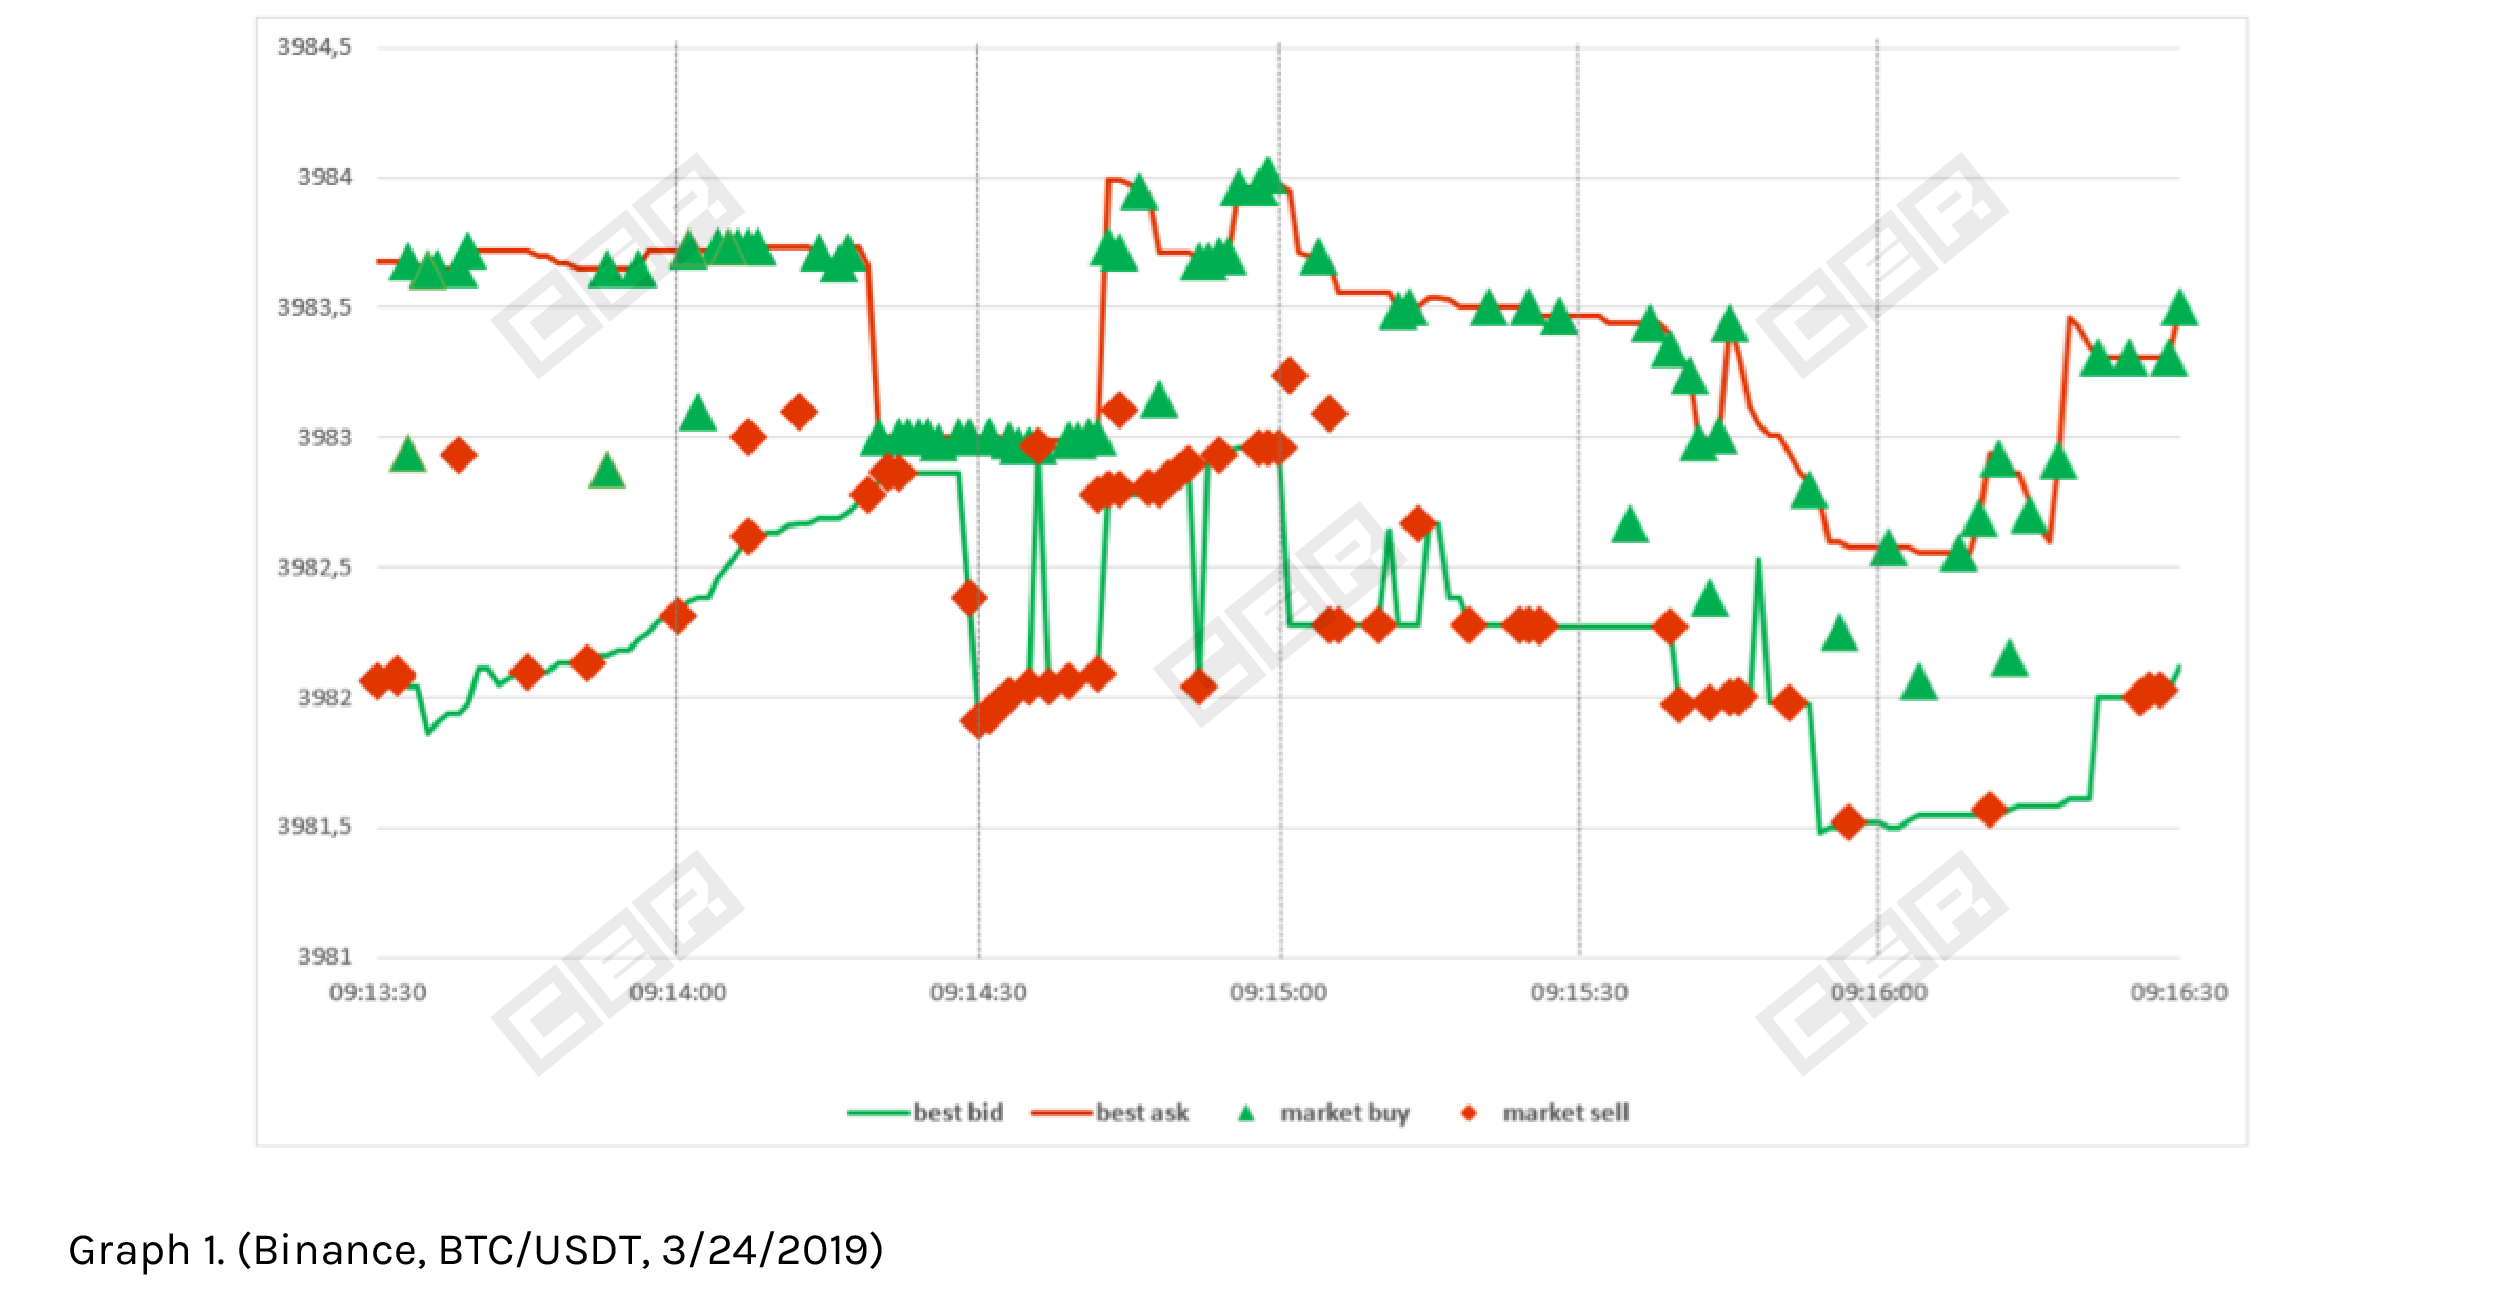
Graph 1 shows regular trading activity where most of the transactions match either the bid or ask prices. However, 16 out of 215 trades (7.44% of the total) within the sample 3-minute period were executed inside the spread. Taking into account the solid trading activity of 72 trades per minute on average, we consider this rate normal.
Most of the exchanges that inflate their volumes with the method described in this article include some randomness in trade pricing. The next graph displays an example of such a technique where trades are randomly priced within the spread.
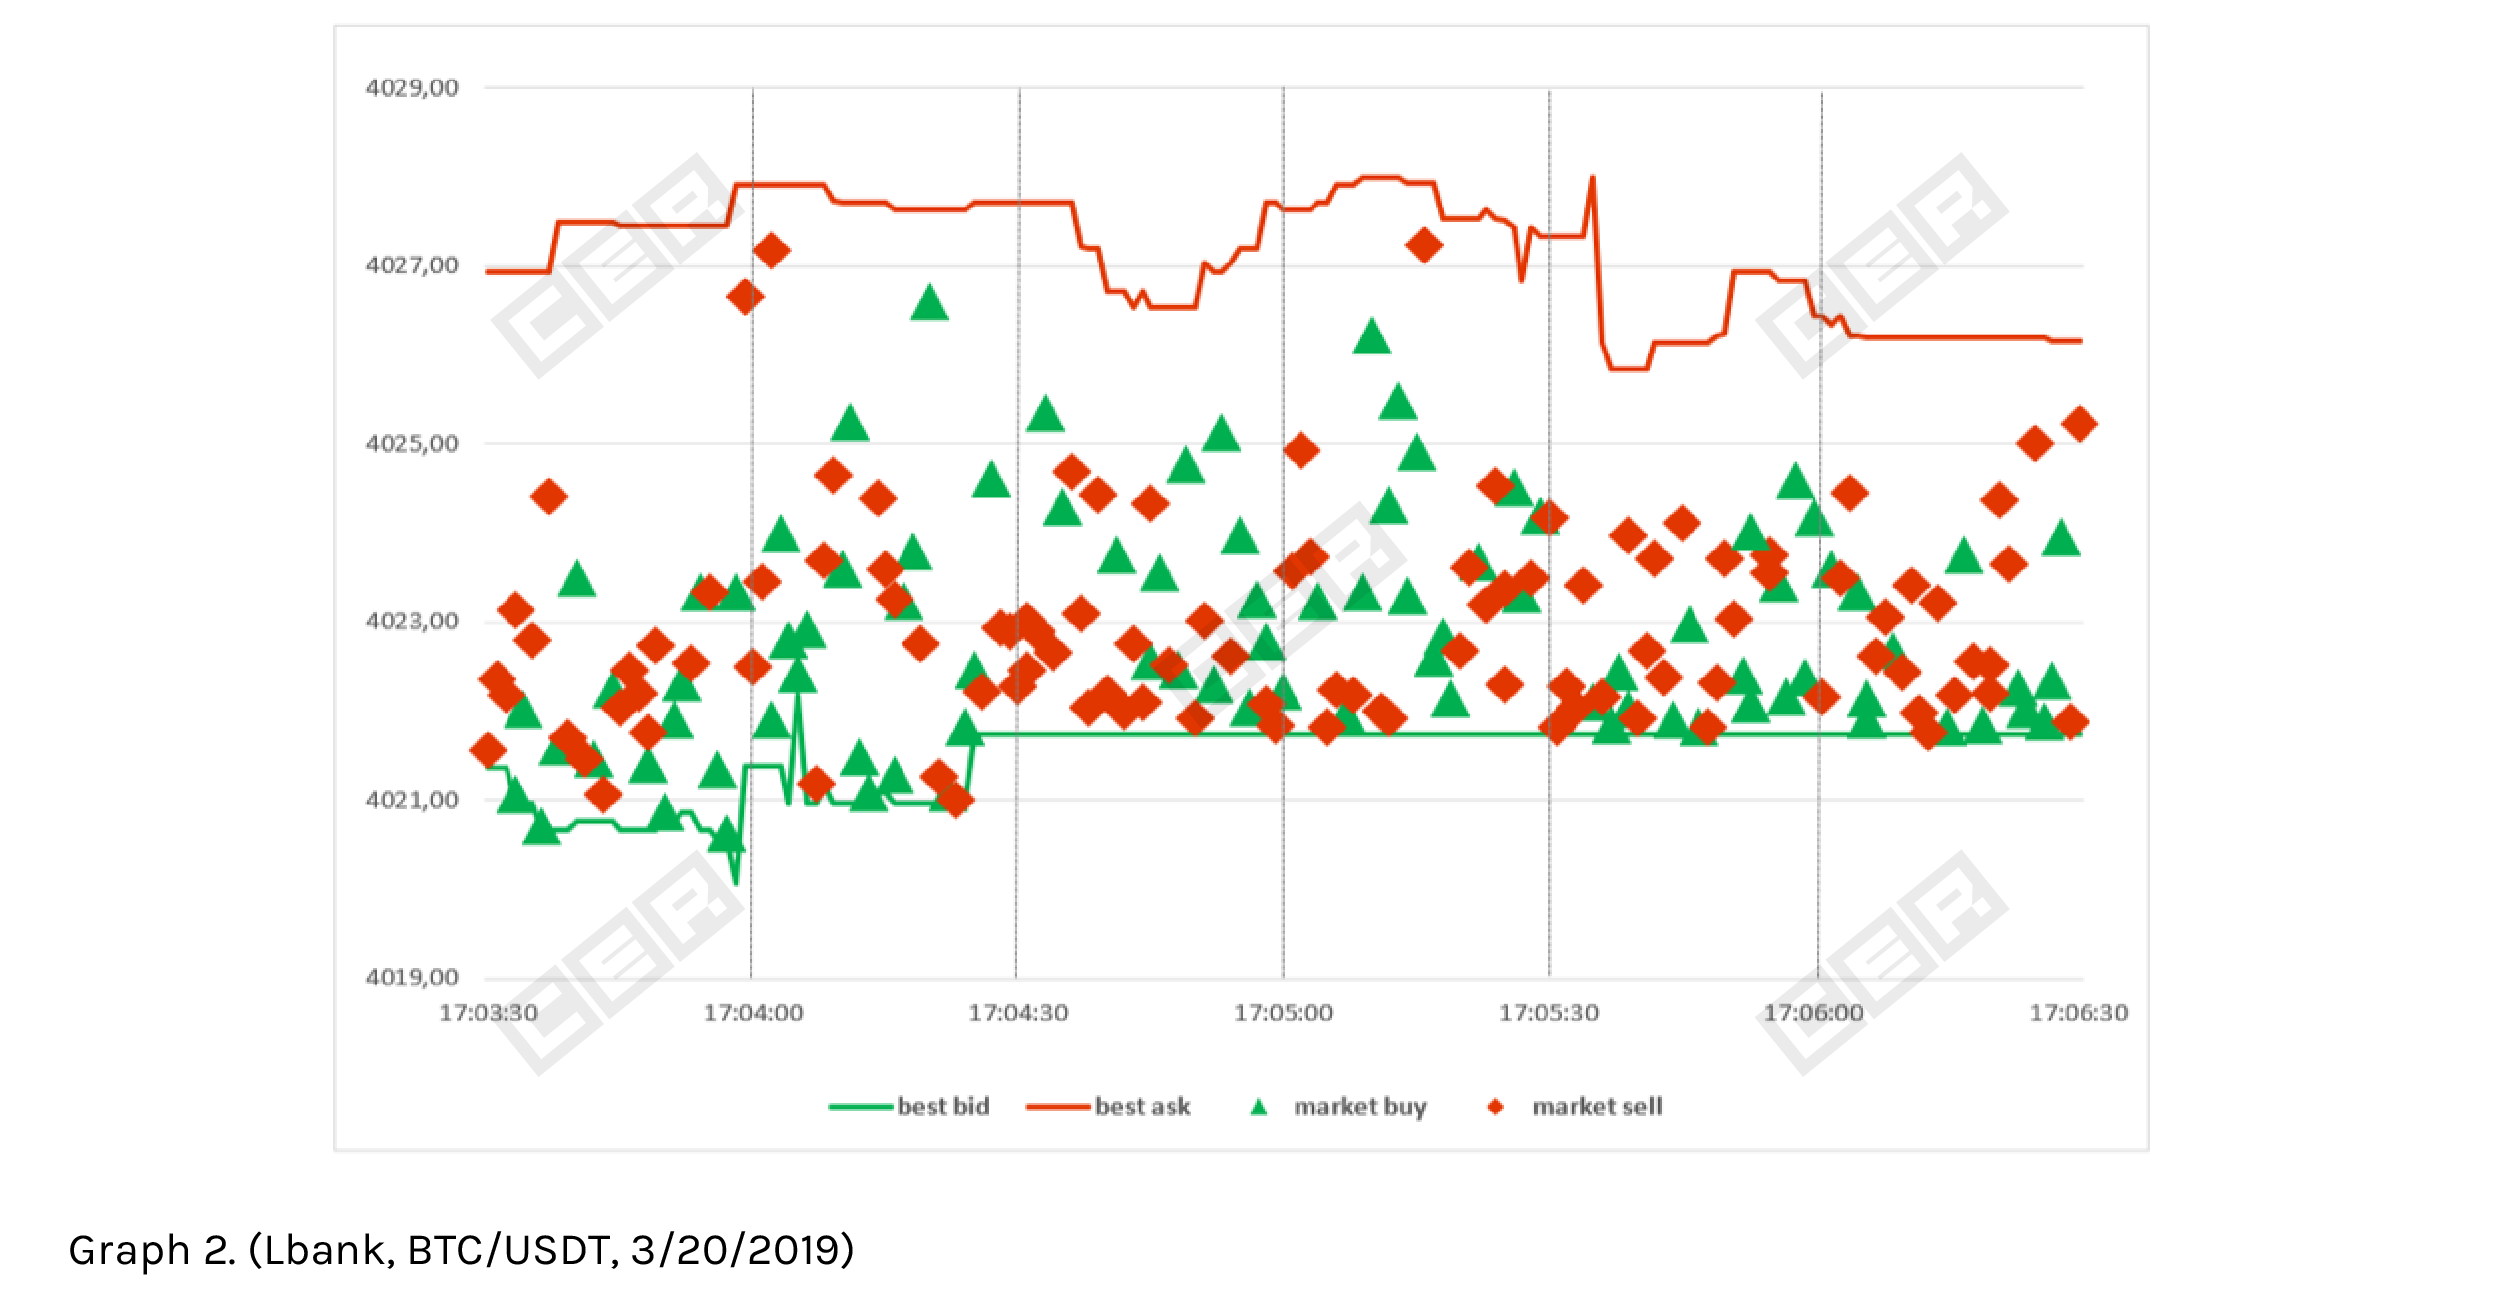
Graph 2 depicts 194 trades executed in BTC/USDT pair on Lbank exchange in sample 3 minutes. All of them were priced inside the spread quite randomly but with a tendency to concentrate closer to the best bid.
The next graph shows how some exchanges don’t care to ensure the plausible appearances of their trades.
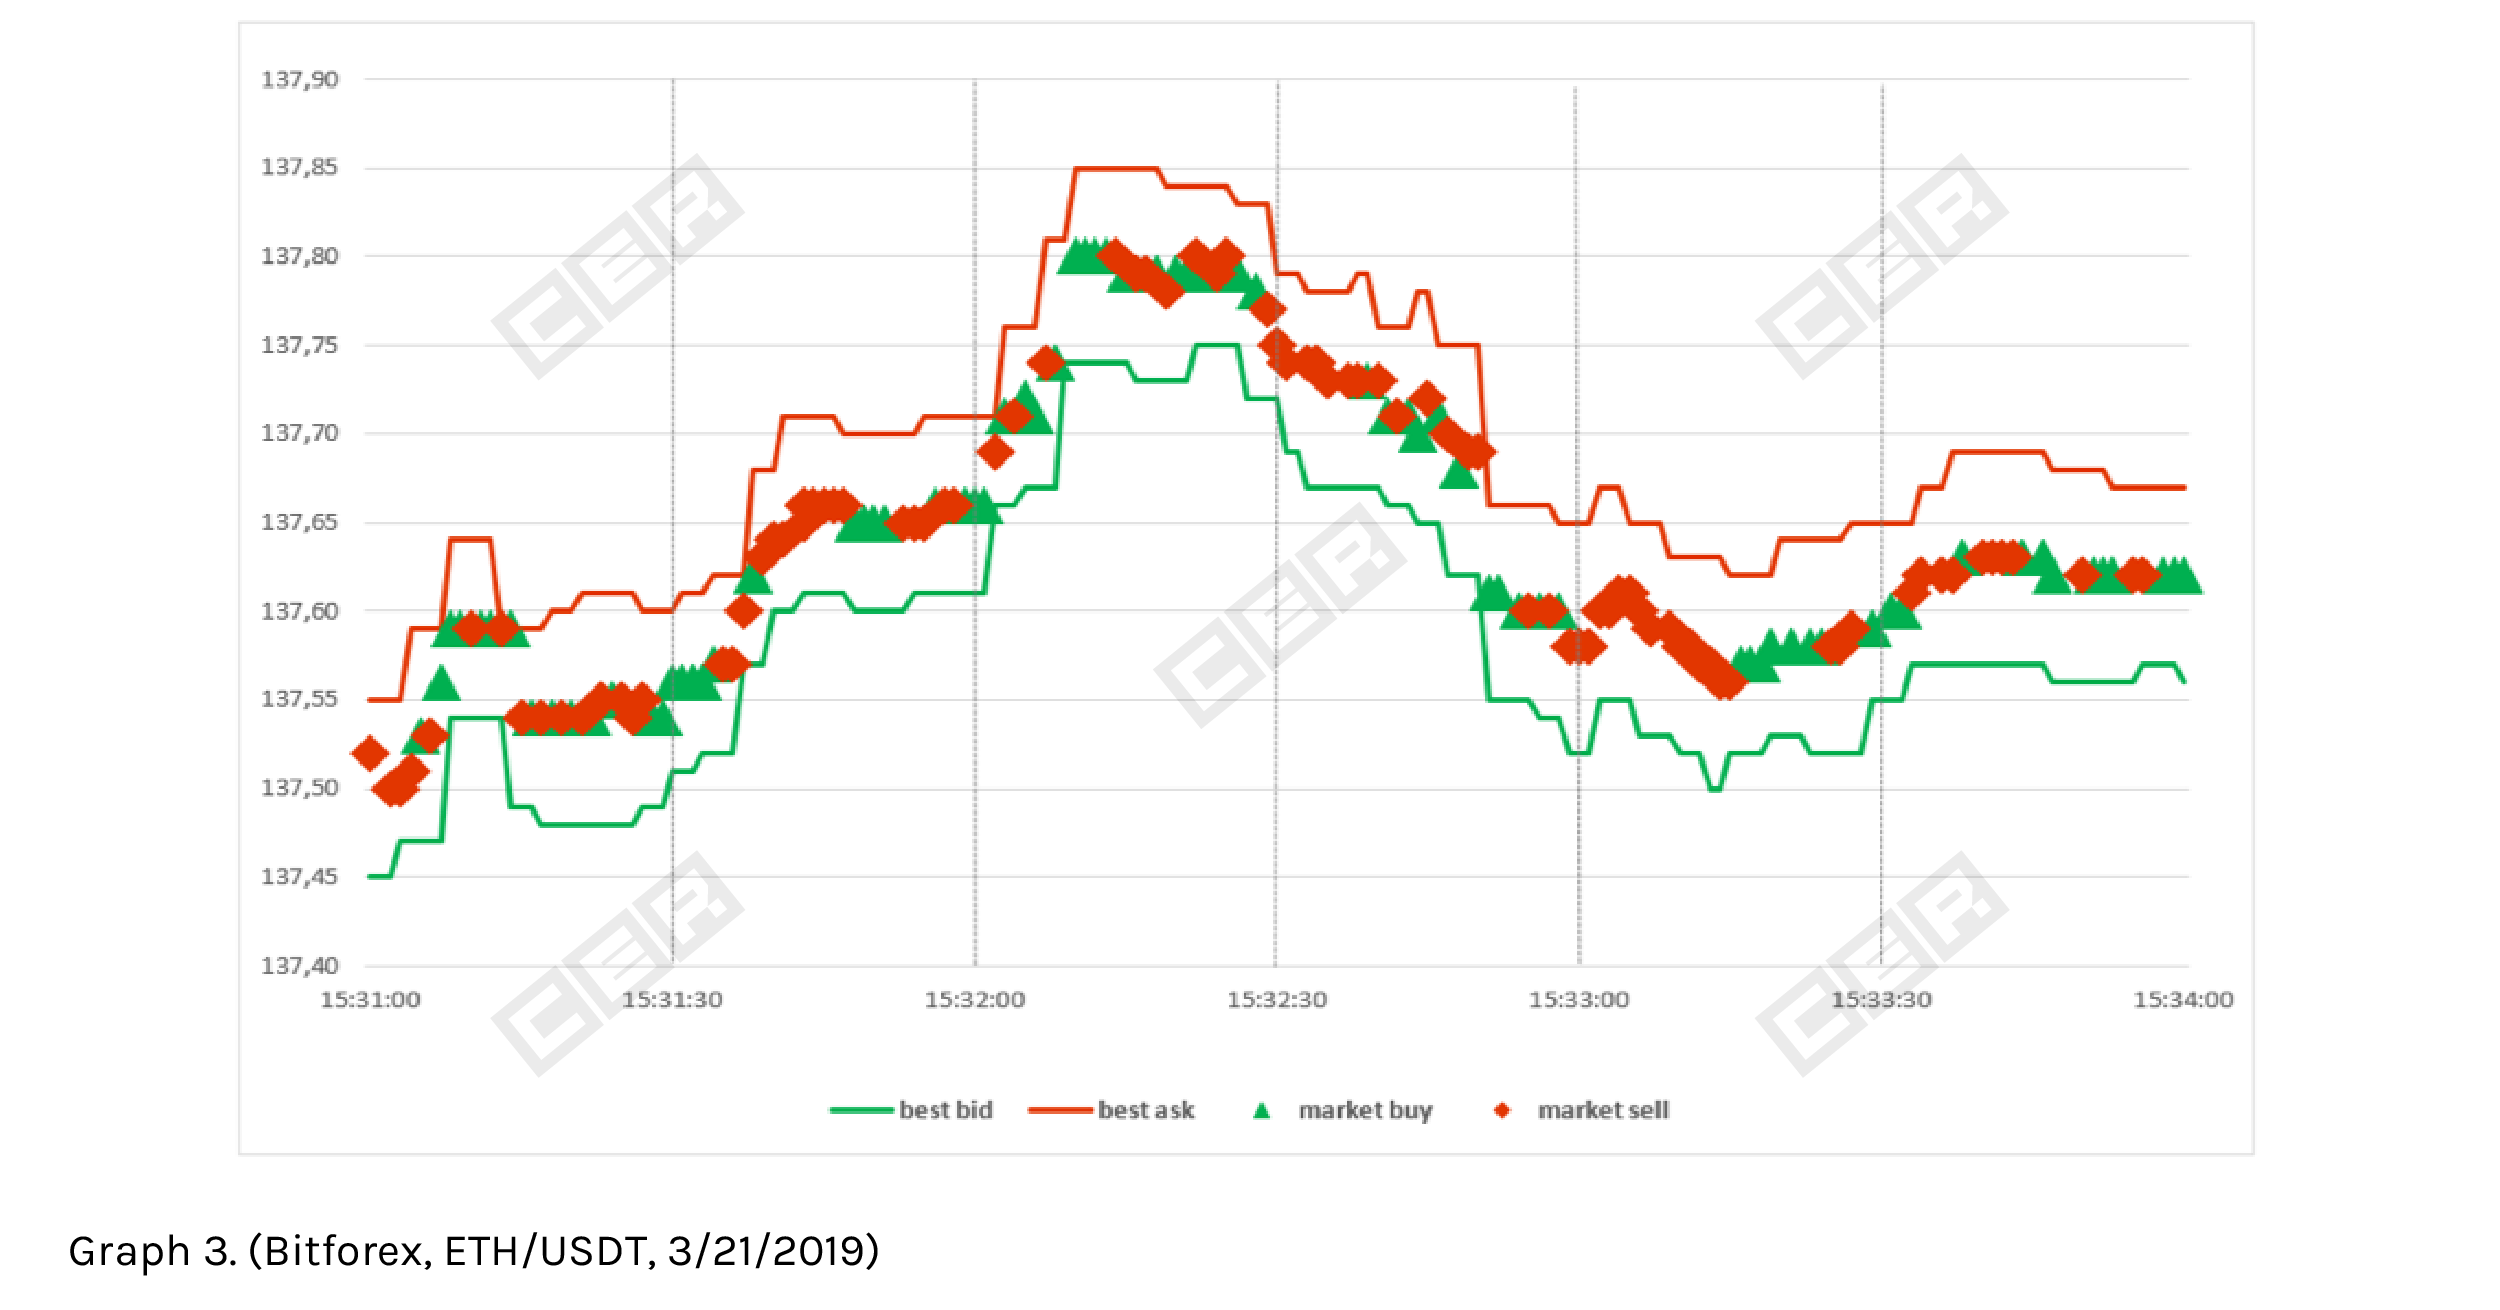
On Graph 3, we can see that despite substantial price fluctuations within the 3-minute period, the spread held stable width around 10 cents (0.073% of the price) in ETH/USDT pair, and more importantly, all of the trades were executed exactly in the middle of the spread. It couldn’t be more simple to determine the execution price inside the spread other than by finding the average of the bid and ask prices (by formula (best bid + best ask) / 2). All of 162 trades occurred in sample 3-minute period were priced that way.
And the next case is an even more flagrant example of faking trade volume by trading inside the spread.
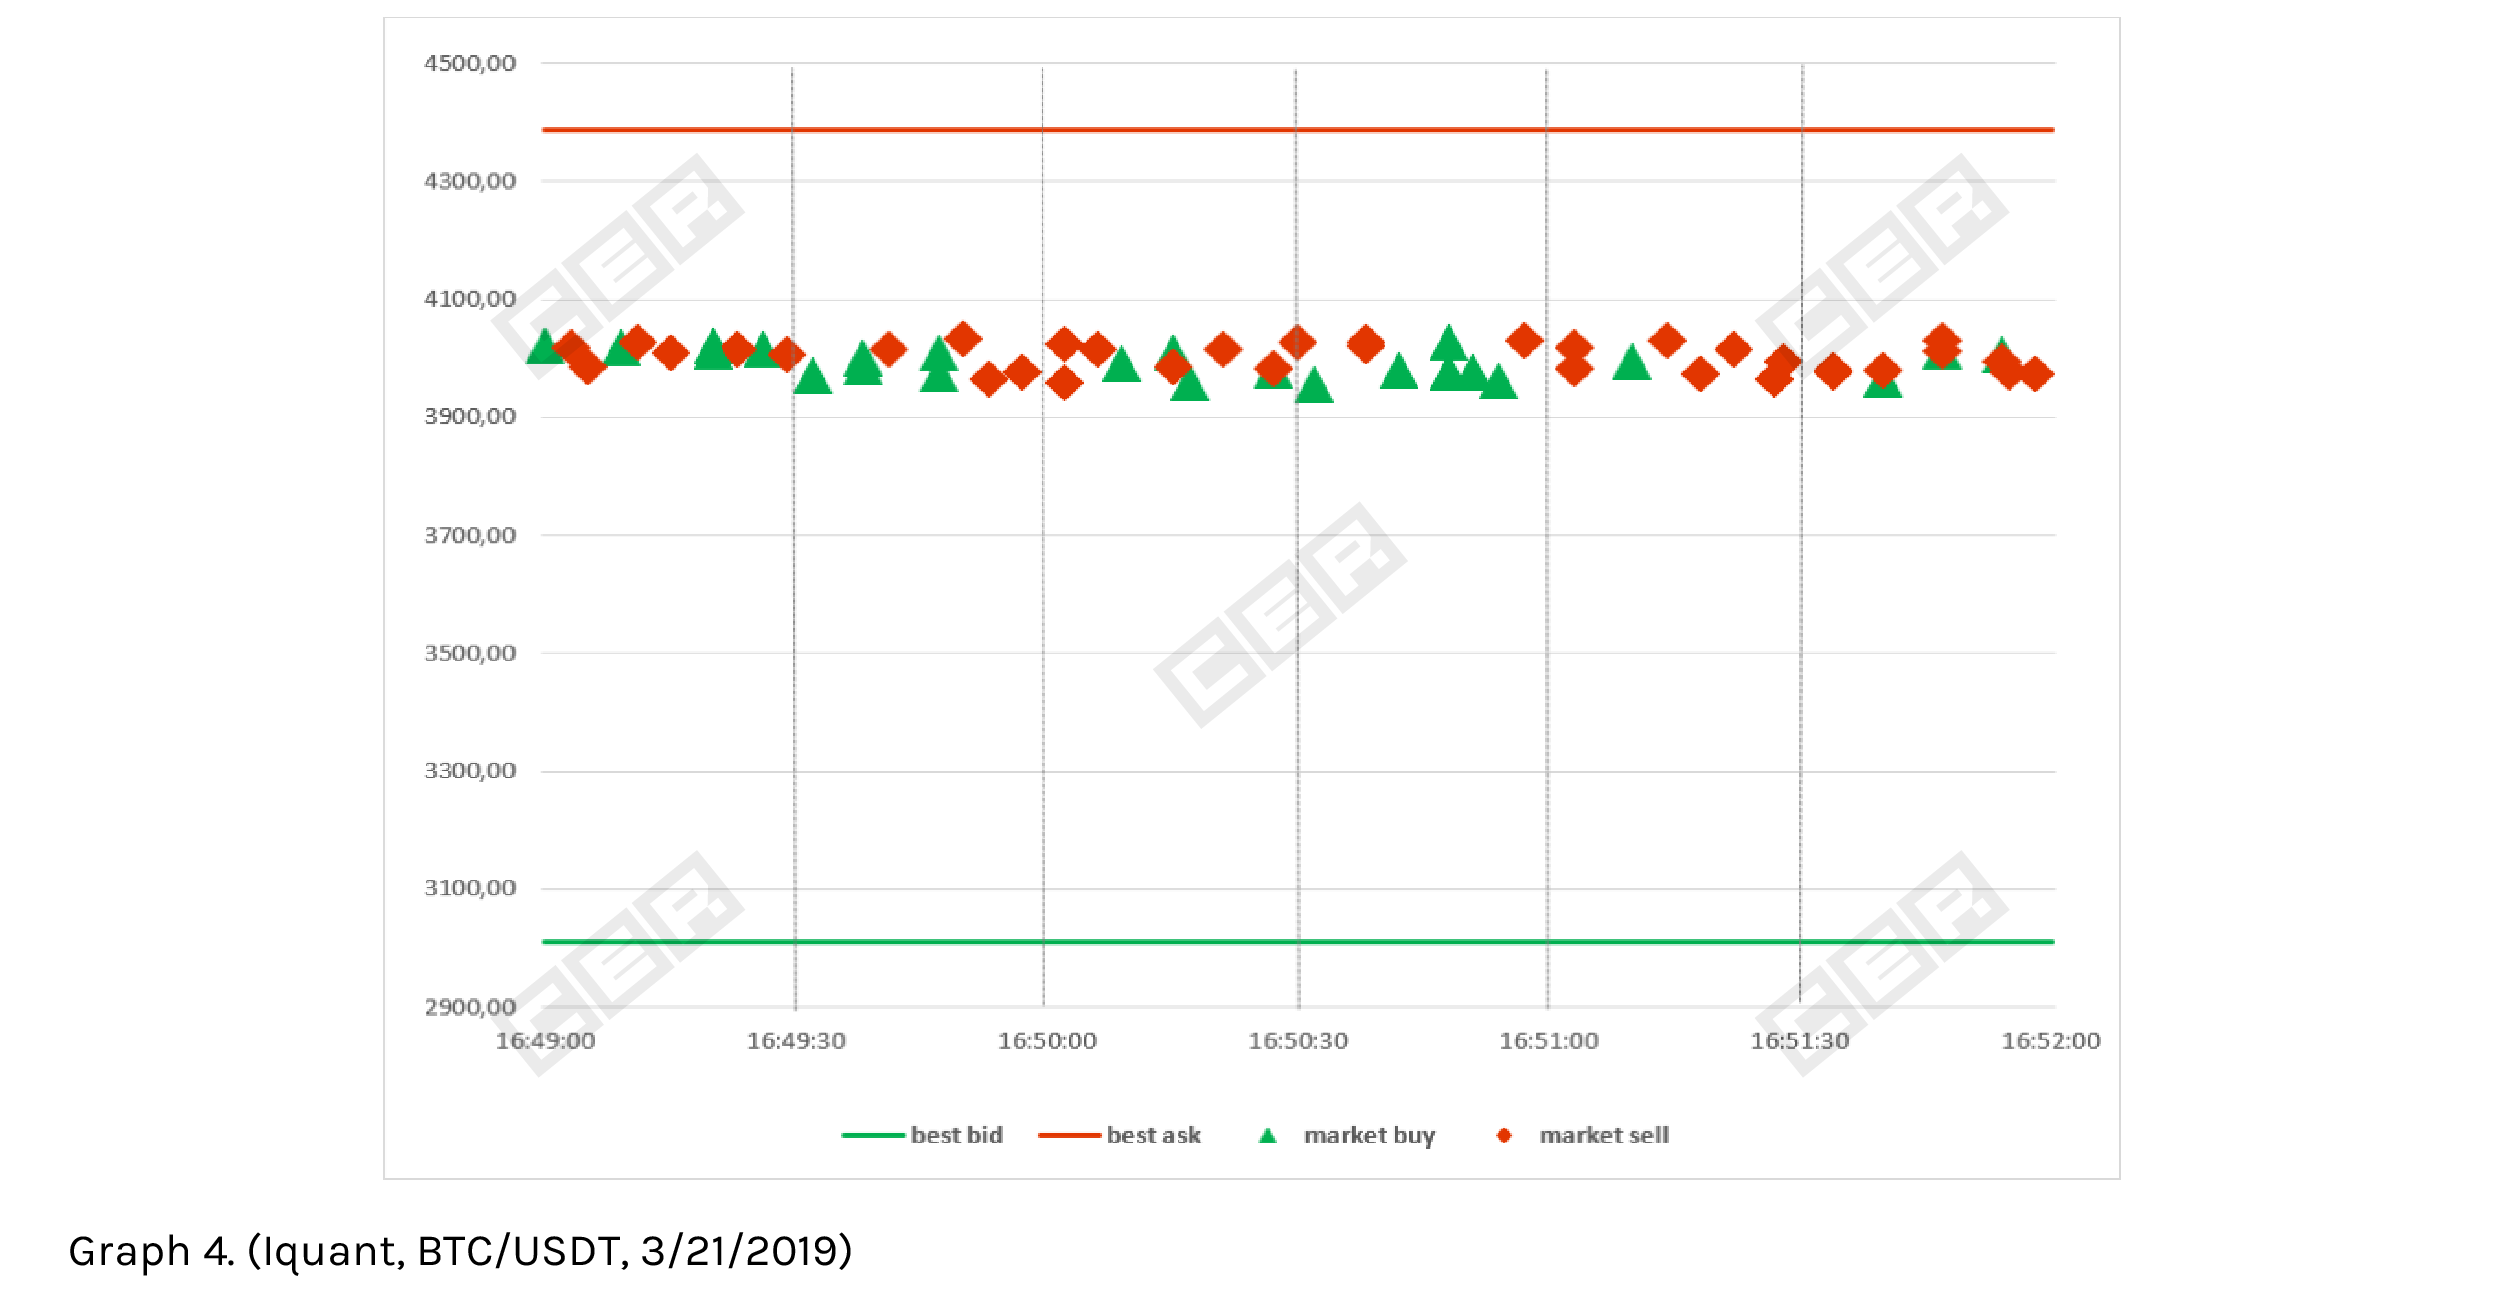
Graph 4 displays the constant enormous spread of $1378 in BTC/USDT pair on Iquant exchange and the “stable” trading activity within it. Trading is stable in terms of trades frequency (1 trade per 3 seconds on average) but trade prices fluctuate about $77 from high to low through a 3-minute period. And that “trading” results in over $40mln daily volume in the pair. We see no reason for that volume to be real.
Thus, trading inside the spread is the simplest and most often used way for crypto exchanges to inflate their trade volumes. Despite its commonness, such a method is not hard to detect. You can read about a related case in our recent Bgogo exchange review. Remember, in some cases, it can be screamingly obvious. For that reason, everyone can and should check their exchange for such foul play in order to avoid losing their money to fake trade volumes.