Introduction to the Trading RTD
List view widget
The List view widget displays the last bid/ask quotes and prices of the most recent transactions. When you look at it first, the widget resembles a common Market Watch. However, it is much more than that — it gathers information from different crypto exchanges across different currency pairs, which saves you a lot of time since you can get the information you need from one source. Besides, the List view is fully customizable and allows you to select coins and exchanges you like and form a Watch List.
Market Depth view widget
The Market Depth view widget represents the cumulative volume of orders — it groups them into 17 bid and 17 ask volume histograms. The widget performs a high-level assessment of bull/bear market imbalances in no time. The widget view is standardized to look the same for any currency pair on any exchange so there is no need to get used to Market Depth widgets on various exchanges anymore. We save your time and allow you to focus on decision making.
Chart view widget
The Chart view widget shows graphs for current and historical prices and volumes. It uses charts with different bar styles on a set of time intervals and allows to use a great number of technical analysis indicators and tools. The main goal of the widget is to visualize market data to simplify the analysis process and make it intuitively understandable. By means of different drawing tools and indicators, you will be able to recognize, catch, and ride a trend — a key skill to have when it comes to successful trading.
The Chart view has been collecting OHLCV data since January 1st, 2018. OHLCV (open-high-low-close-volume) is the visualization of price chart with candles which display data on trade prices: open, highest, lowest, closing, and volume. This is the most common way of presenting charts. CER employs technologies for processing and billing big data (hundreds of gigabytes of records). It saves the data in a high-speed storage and processes it to send to the customer. The platform uses the Trading View, a convenient tool for time-series data. As a result, the Chart view allows customers to see developments on a time scale, while the Markets Depth view evaluates trading opportunities in real time.
The Trading RTD allows evaluating investment ideas using just one tool — CER. Together with other dashboards, CER becomes the only all-inclusive trading tool to make sophisticated and weighted trading decisions.
Try it now as from October 1, 2018, full functional of Crypto Exchange Ranks will be available under paid subscription.
Subscribe
to our
newsletter
Be the first to receive our latest company updates, Web3 security insights, and exclusive content curated for the blockchain enthusiasts.

Table of contents
Tell us about your project
Read next:
More related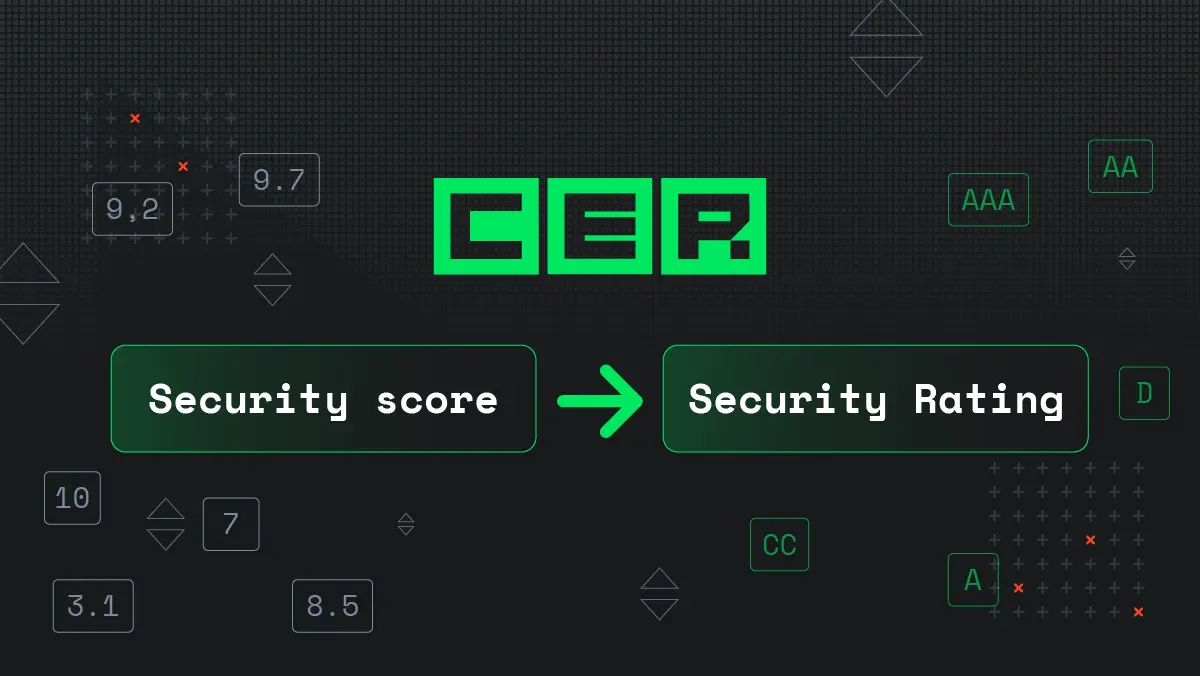 CER.live: the transformation of cybersecurity score into cybersecurity rating
2 min read
Hacken News
 Hacken October 2020 in Review
3 min read
Hacken News
 WE WILL NEVER RAISE YOUR CSS SCORE FOR MONEY!
2 min read
Hacken News